
WED, Vol. 1, Issue 3
In this issue, we reviewed Statistics Canada’s Labour Force Survey for August 2022. We looked at areas in our province where we can boost labour force participation and how we can convert more part-time to full-time staff. In August 2022, both Canada’s and Manitoba’s labour force1 grew month-over-month. At the same time, the number of employed people fell. These two factors increased the unemployment rates of both Canada’s and Manitoba’s in August 2022.
We also factored in our findings from our previous issue where we considered how labour demand has evolved from October 2020 through June 2022. We considered how a measure of labour demand slack (job vacancies) compares to a measure of labour supply slack (unemployment) for the same period. As we have recovered from the worst of the pandemic, job vacancies have been rising and unemployment falling through June 2022. The unemployment/job-vacancies ratio (U/JV) for June 2022 was the tightest it has been since before the pandemic, which means there are many job vacancies available and not enough workers to supply that demand. Manitoba’s U/JV ratio in June was 0.9, while Canada overall was 1.0.2 A U/JV ratio that is one or higher indicates greater ease for an employer to hire.
How can employers attract talent with the necessary skills and experience to supply the demand for these jobs?3 Our province may look at encouraging Manitobans who are not in the labour force to look for work and thus (re)joining the labour force. For example, this could be young students looking for their first job, formerly discouraged workers resuming their search or parents of young kids resuming a paused career. Attracting talent from other provinces with excess workers may also help fill jobs in want of qualified talent. The main source of talent will continue to be net immigration to Manitoba from other countries.4
Analysis
When we considered Manitoba’s June 2022 U/JV ratio, it was below one, which shows market tightness and hiring challenges for employers. There are several ways in which the economy can boost the number of workers available. One way is to encourage working-age Manitobans to look for work. Another way is to convert those employed from working part-time to full-time.
The share of the unemployed who are long-term unemployed (six months or more) has fallen significantly after hitting a pandemic driven peak in December 2020 for Canada, and April 2021 for Manitoba.5 A lower share of the unemployed that has been unemployed for six months or more usually indicates an improvement in the speed of job matching.
Labour Force Participation Rates
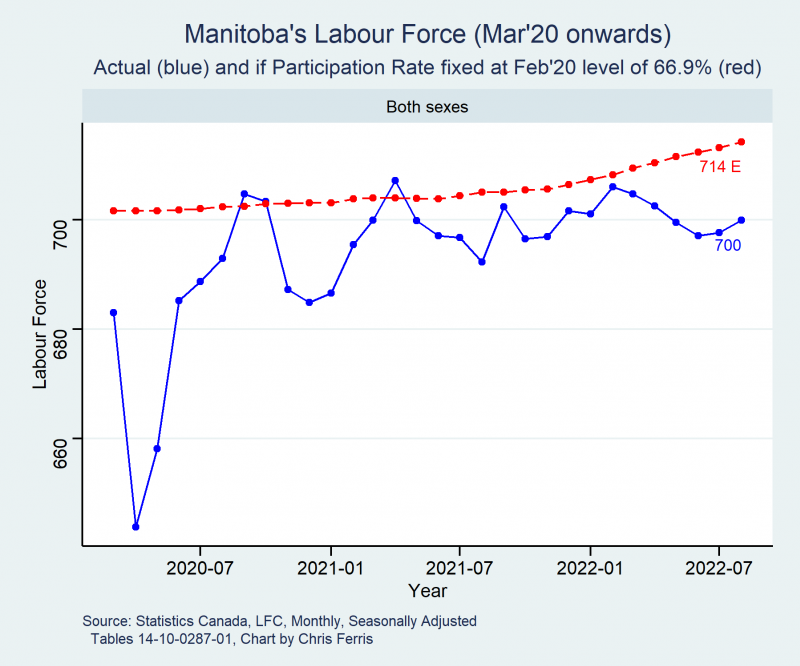
Manitoba’s seasonally adjusted, overall labour force participation rate in August 2022 was 65.7 per cent. This is below the pre-pandemic participation rate of 66.9 per cent in February 2020. We would have approximately another 14,000 potential workers in August 2022 if the participation rate were held constant at 66.9 per cent.
Labour Force Non-Participation Rates
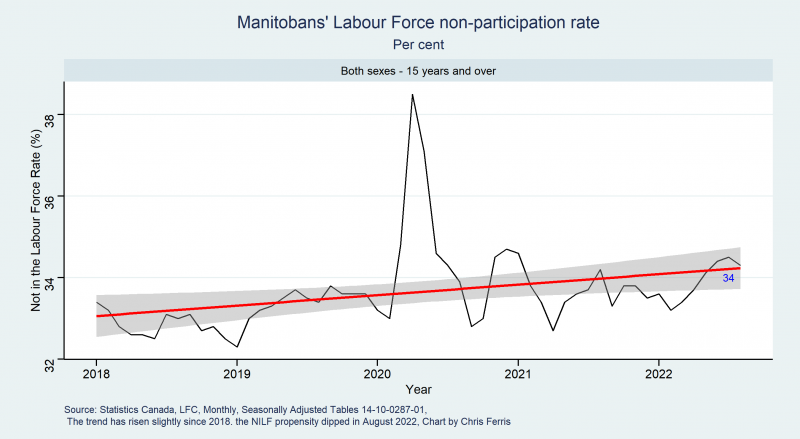
The initial COVID-19 lockdown saw the share of the Manitoba working age population not in the labour force (NILF) surge to 38.5 per cent in April 2020.6 The share of the Manitoba working age population NILF for those aged 15 and above, and both male and female was 33.4 per cent in January 2018. This has risen to 34.3 per cent as of August 2022 (black line).7
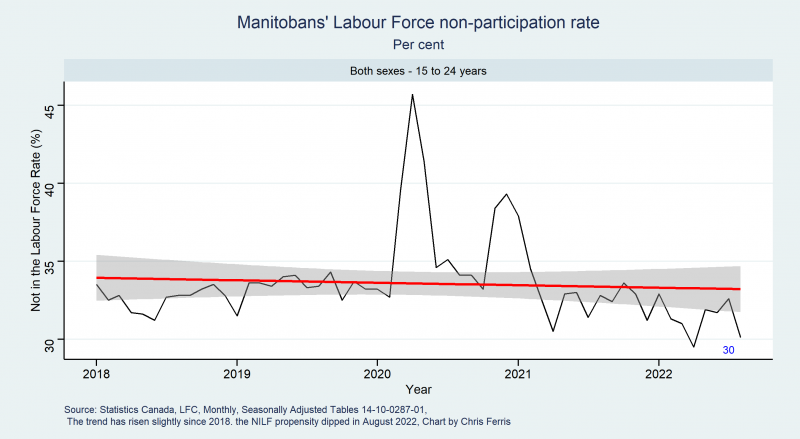
For those aged 15 to 24, there was a large surge of people NILF in April 2020 at 45.7 per cent. Since then, the NILF share has returned to trend or even lower. In August 2022, this NILF share has subsided to 30 per cent.
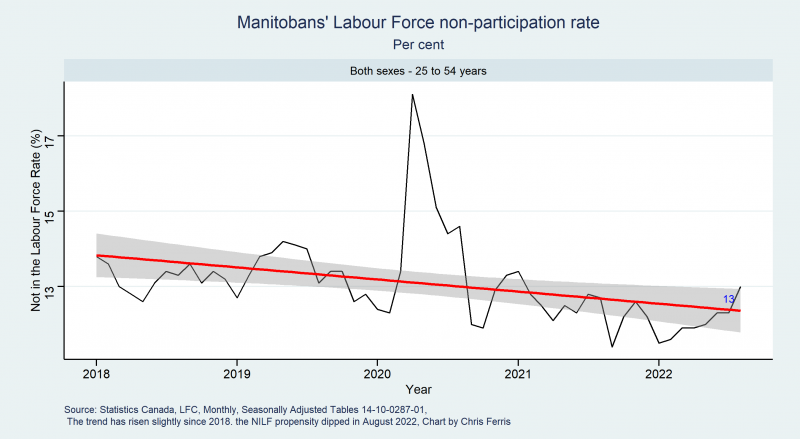
For those aged 25 to 54, the NILF share rose to 18.1 per cent at its pandemic peak in 2020. Its NILF trend is slightly downward, with the August 2022 share now at 13 per cent.
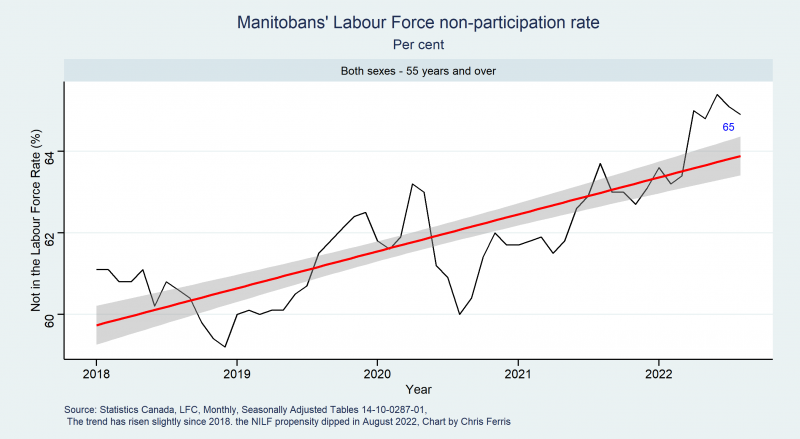
Manitobans aged 55 and above have a much higher share of those NILF, which is 65 per cent in August 2022. There was a small surge of those NILF in early 2020. The trend has been rising from 60 per cent in August 2020.
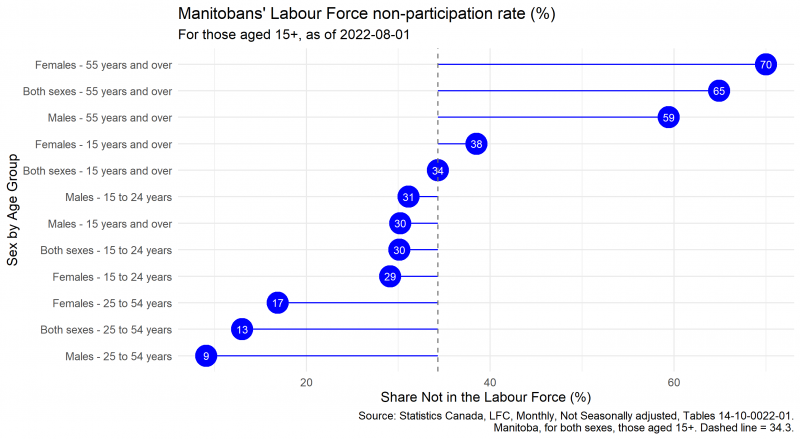
August 2022 – NILF combinations of sex and age groups
Those aged 55 and above have a much higher share of those NILF than average (59 to 70 per cent). The core working population, those aged 25 to 54, have a much lower share of those NILF. Considering all ages, males have a lower NILF share than females. The difference is much closer for those aged 15 to 24, with a range of approximately two percentage points.
Workers aged 55 and above have increasingly exited the labour force since the beginning of 2021. A portion of these Manitobans retired and are not interested in returning to work, but some may be interested in rejoining the labour force. Manitobans ages 15 to 24 who are currently unemployed may also join the labour force.
Part-time share by industry
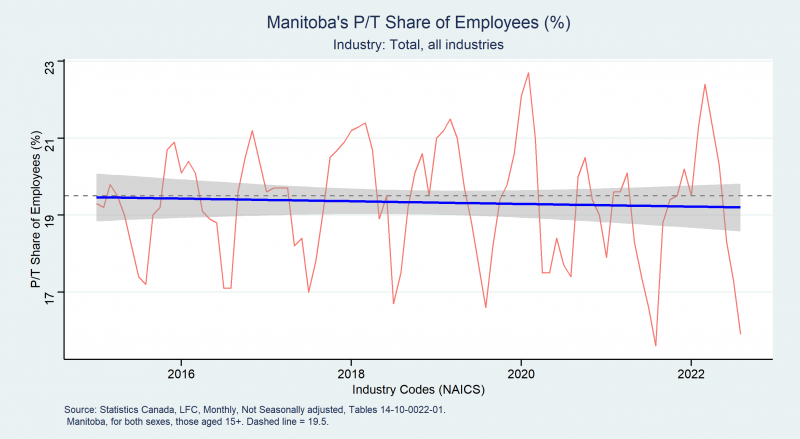
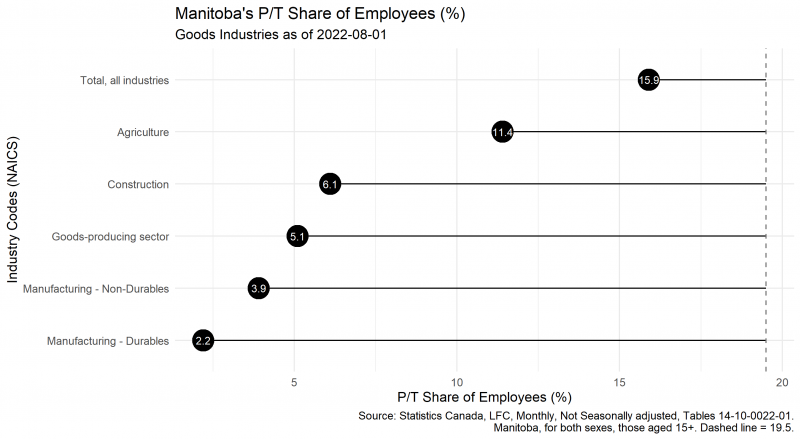
There is significant seasonality in the share of Manitoban workers aged 15 and above, both sexes and all industries (red line). For January 2015 through August 2022, the average share of Manitobans who worked part-time is roughly 19.5 per cent (dashed line). Over this period, part-timers have ranged between approximately 15 to 23 per cent (red line). The share of all employees working part-time has declined slightly over the period, as is indicated by a simple linear model (blue line). The standard error around the linear model is shown by the shaded grey area.
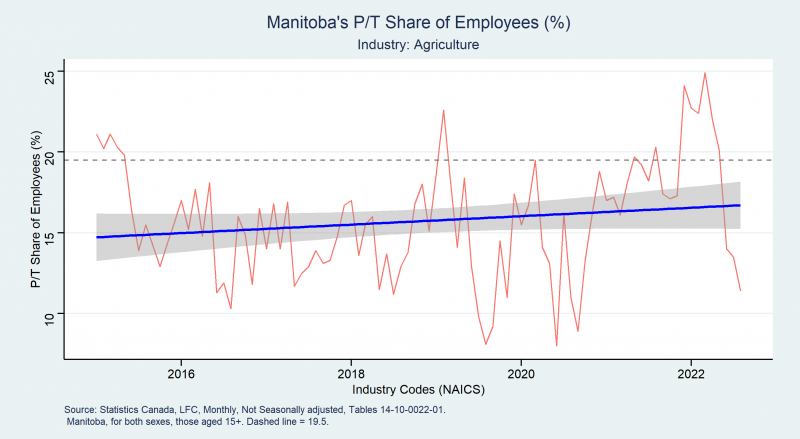
Agriculture in Manitoba has even more significant seasonality of part-time employee share, ranging from about five to 25 percent, depending on the year and the season. It is currently on a seasonal down swing, after a significant upswing earlier in 2022.
If we just consider the August 2022 data by industry, we can see the following data for all industries and the goods industries. First, all industries share is on its seasonal down-swing as we head into the fall, as is agriculture. Construction has less variability than agriculture, but still has a seasonal portion. There is consistently little part-time work in the manufacturing sectors.
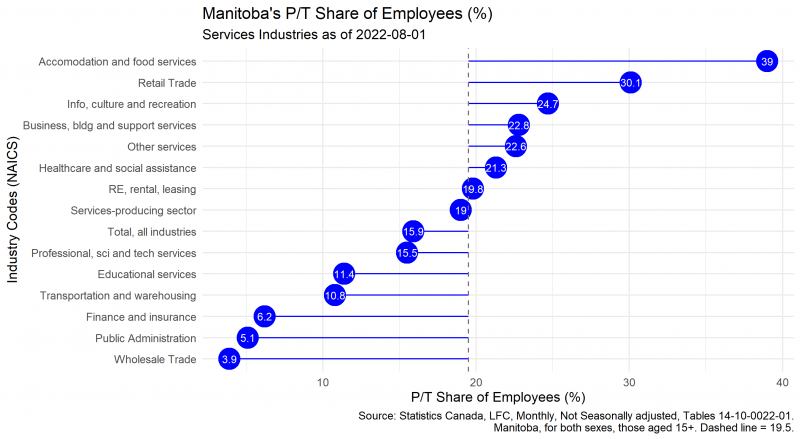
When we consider the services industries, there is much more variability. Accommodation and food services typically have the highest share of part-time workers, followed by the retail trade then info, culture, and recreation. Finance and insurance, public administration, and the wholesale trade have low shares of part-time workers, comparable to construction and the manufacturing sectors.
High-level Labour Statistics
| Canada (Thousands, except rates) | ||||
|---|---|---|---|---|
| 15 years+, both sexes | July 2022 | August 2022 | M/M % Change | Y/Y % Change |
| Population | 31,782.2 | 31,831.6 | 0.2 | 1.5 |
| Labour Force | 20,573.6 | 20,639.8 | 0.3 | 1.2 |
| Employment | 19,566.5 | 19,526.8 | -0.2 | 3.1 |
| Unemployment | 1,007.1 | 1,113.0 | 10.5 | -23.5 |
| Participation Rate | 64.7 | 64.8 | ... | ... |
| Unemployment Rate | 4.9 | 5.4 | ... | ... |
| Employment Rate | 61.6 | 61.3 | ... | ... |
In August 2022, on a month-over-month basis, Canada’s:
- Working age population grew 0.2 per cent,
- Labour force grew 0.3 per cent,
- Employment fell 0.2 per cent and
- Unemployment grew by 10.5 per cent.
- Unemployment rate rose by 0.5 points to 5.4 per cent in August 2022.
- Stats are still a substantial improvement over where it was a year ago.
| Manitoba (Thousands, except rates) | ||||
|---|---|---|---|---|
| 15 years+, both sexes | July 2022 | August 2022 | M/M % Change | Y/Y % Change |
| Population | 1,064.3 | 1,066.0 | 0.2 | 1.3 |
| Labour Force | 697.6 | 699.9 | 0.3 | 1.1 |
| Employment | 673.2 | 663.2 | -1.5 | 1.7 |
| Unemployment | 24.4 | 36.8 | 50.8 | -8.0 |
| Participation Rate | 65.5 | 65.7 | ... | ... |
| Unemployment Rate | 3.5 | 5.3 | ... | ... |
| Employment Rate | 63.3 | 62.2 | ... | ... |
In August 2022, on a month-over-month basis, Manitoba’s:
- Working age population grew 0.2 per cent,
- Labour force grew 0.3 per cent,
- Employment fell 1.5 per cent and
- Unemployment grew by 50.8 per cent.
- Unemployment rate rose by 1.8 points to 5.3 per cent in August 2022.
- Stats are still a substantial improvement over where it was a year ago.
With a rising labour force, this should also help both sides of the job market—job vacancies and employment rates—to match up.
____________________
1. The labour force (LF) is defined as those of the working age population (P) who are employed (E) and those who are unemployed (U). Those not in the labour force (NILF)? NILF = P – (E + U). See Statistics Canada’s Labour force status of person webpage for the specific definitions of each.
2. Canada, excluding the four Maritime provinces has the same U/JV ratio as Manitoba (0.9).
3. It is important that job candidates and potential employers not let the search for a perfect fit be the enemy of a good fit. Job candidates who have a lot of the desired skills (but not all of them) could easily be hired, and then backfill other skills via training upon being hired.
4. Manitoba has had great success in attracting immigrants with the Manitoba Provincial Nominee Program (MPNP). Manitoba is currently reviewing the program to make it even more successful, considering other provinces' programs have become more competitive over the years.
5. See Statistics Canada’s table 14-10-0342-01 on unemployment by duration for details.
6. The participation rate (LFP_Rate) divides the number employed and unemployed by the working age population. The non-participation rate simply subtracts the labour force participation rate from one, or NILF_Rate = 1 – LFP_Rate
7. The red line is a linear trend line. The standard error around the linear model is shown by the shaded grey area. See Standard error - Wikipedia for a definition of a standard error.